Excel: How to visualize formula dependencies
Suppose you want to know what the impact of changing the value of a cell would be. Excel provides an easy way to visualize all the cell that will be impacted by change the value of a cell.
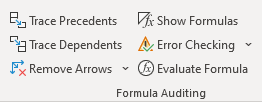
To visualize cell dependencies in Excel, go the Formulas ribbon and choose Trace Dependents or press ctrl+shift+].
Following are detailed step-by-step instructions:
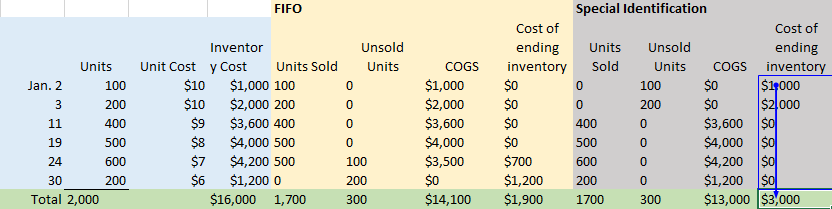
I have the following Excel worksheet where the data is created by multiple formulas:

I want to see which cells will be impacted if I change the value of unit cost of 100 units. To visualize this, I click on the cell I am interested in and then go to the Formulas Ribbon:

Then click on Trace Dependents:
This would show me the following:

Note that the arrows trace dependencies. If I click on Trace Dependents again, it will show me the next level of dependencies as follows:

I can keep doing this until I reach a point where there are no more dependent cells.
A shortcut to see the dependencies is to press ctrl+shift+]. This will show all dependent cells but will now show the hierarchy. See below:

Tracing Precedents
I can also see all precedents i.e. cell that provide values used in the formula of my cell. To do so simply, choose the desired cell and choose Trace Precedents which is just above Trace Dependents:
This is what it looks like:
and the following if I press Trace Precedents again:

I can also use the shortcut ctrl+shift+[, which shows the following:

Tracing makes it easier to understand the impact of changes to a worksheet. I hope this helps.